Satellite-Grade FPGA Logic Analyzer and Data Logger for SPI Debugging
Table of Contents
Why Debugging SPI in Complex Systems is Challenging
High-speed serial communication forms the backbone of modern embedded systems, particularly in aerospace and satellite applications, where reliability is a strict requirement. Among the commonly used protocols, SPI (Serial Peripheral Interface) is widely favored for its simplicity and high data rates. However, it has one major drawback: lack of built-in error detection and debugging tools.
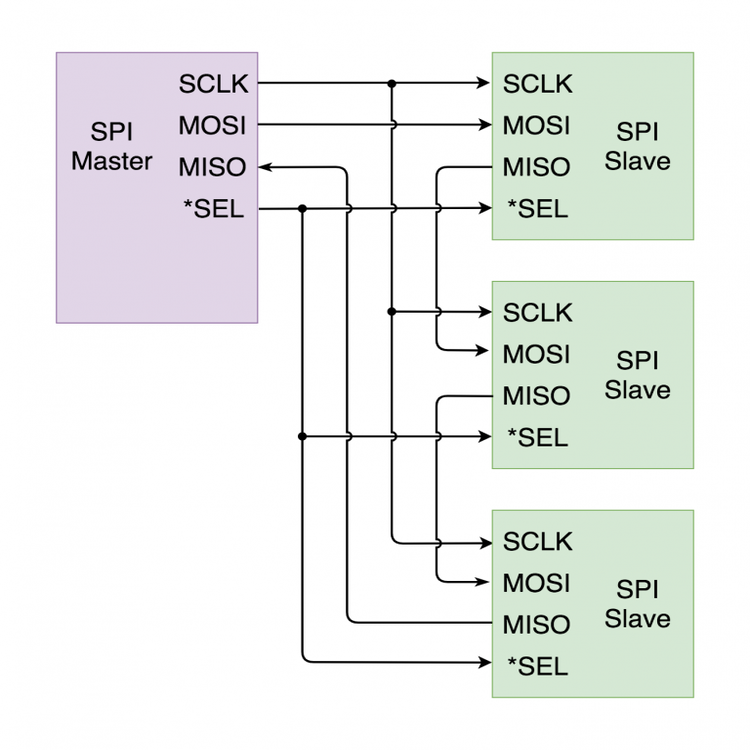
When debugging simple SPI topologies, where each slave device is directly connected to the master, traditional tools such as oscilloscopes, logic analyzers, and software-based debugging are often sufficient. But when working with complex multi-device SPI topologies, where messages must traverse multiple relays before reaching their destination, issues arise that are not immediately obvious. A single misalignment in packet reconstruction can scramble an entire data stream.
During my bachelor’s thesis, I designed an FPGA-based logic analyzer and data logger to assist in SPI debugging. Over time, it became a valuable tool in my workflow. However, when I started testing a daisy-chained SPI topology, the logged data made no sense—the payloads were scrambled, and expected patterns were missing. I had encountered a debugging challenge that traditional methods alone couldn’t resolve.
This post explores how I tackled the problem, from initial system design to real-world failures and ultimately to machine learning-assisted post-processing, which revealed the hidden patterns in the data.
Designing an FPGA-Based SPI Debugging System
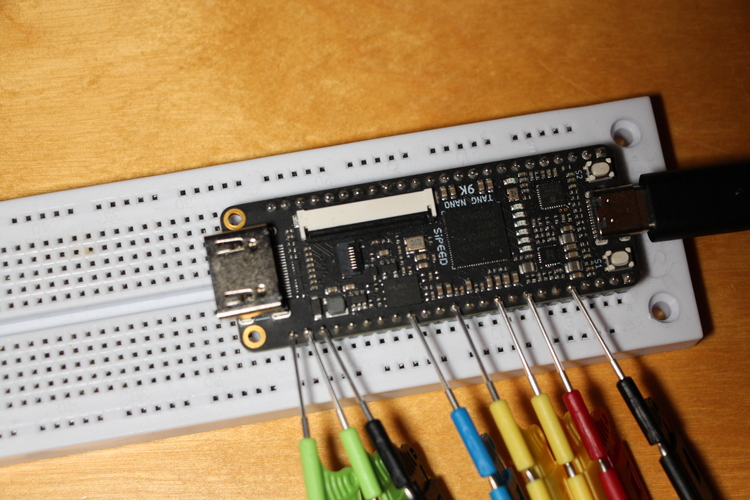
The initial goal was to develop a real-time SPI debugging tool capable of capturing high-speed SPI transactions without interfering with communication. A purely software-based logging solution wasn’t feasible due to bandwidth and timing constraints, so I opted for an FPGA-based approach, which allowed for direct signal capture at the hardware level.
Key Features of the Initial Design
- Passive SPI signal capture (MOSI, MISO, SCLK, SS) without disturbing the bus.
- High-resolution data logging stored in BRAM (Block RAM) or SDRAM.
- Trigger-based event detection to selectively capture relevant SPI transactions.
- USB data transfer to a PC for post-processing and visualization.
For the software stack, I integrated:
- Python and Jupyter Notebooks for data visualization.
- Custom VHDL modules to process and store SPI transactions.
- A softcore processor to manage data buffering and communication.
Theoretical Expectations vs. Reality
In simulation, everything worked perfectly. The SPI transactions were captured, logged, and decoded without issue. Initial real-world tests with a simple master-slave configuration also produced expected results.
However, when I introduced a daisy-chained SPI topology, where slave devices relayed messages instead of direct master-slave communication, the captured data became scrambled and incomprehensible.
| Transaction | SCLK (16-bit) | SS (16-bit) | MOSI (16-bit) | MISO (16-bit) | Extracted Payload (Scrambled) |
|---|---|---|---|---|---|
| 0 | 0101010101010101 | 0000000000000000 | 1100110011001100 | 1010101010101010 | 204 |
| 1 | 0101010101010101 | 1111111111111111 | 1010101010101010 | 1100110011001100 | 85 |
| 2 | 0101010101010101 | 0000000000000000 | 0110011001100110 | 1001100110011001 | 178 |
| 3 | 0101010101010101 | 1111111111111111 | 1001100110011001 | 0110011001100110 | 97 |
| 4 | 0101010101010101 | 0000000000000000 | 1100001111000011 | 1010101110101011 | 12 |
| 5 | 0101010101010101 | 1111111111111111 | 1011110000111100 | 1101001011010010 | 56 |
| 6 | 0101010101010101 | 0000000000000000 | 0010110100101101 | 0101101001011010 | 233 |
| 7 | 0101010101010101 | 1111111111111111 | 1101010110101010 | 1110011111100111 | 79 |
| 8 | 0101010101010101 | 0000000000000000 | 0110101001101010 | 1001011010010110 | 201 |
| 9 | 0101010101010101 | 1111111111111111 | 1000111110001111 | 1110000111100001 | 45 |
Real-World Testing: When Debugging Becomes a Nightmare
Once deployed, the system captured SPI transactions as expected, but when I analyzed the extracted payloads, the data was completely nonsensical. The packets looked correct structurally, yet the contents were scrambled beyond recognition.
Troubleshooting the Issue
I systematically ruled out potential causes:
-
Hardware integrity issues?
- The boards I used were inexpensive, and I suspected signal integrity issues.
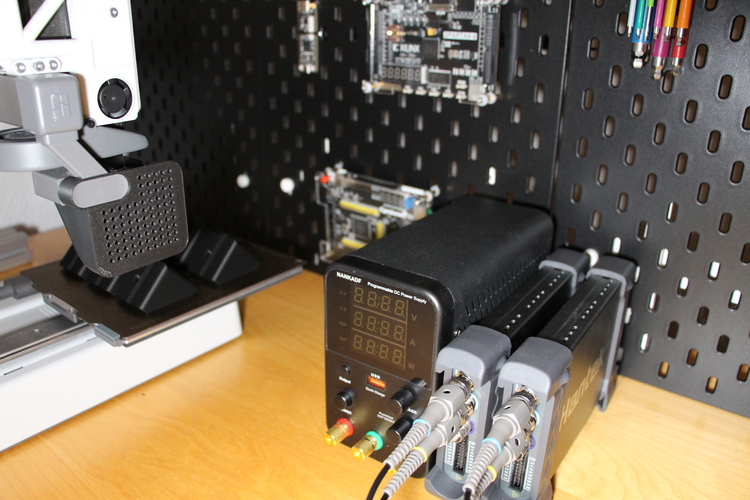
- Oscilloscope measurements showed clean signals and stable voltage levels.
-
Timing misalignment?
- If the SPI clock edges were misaligned, the system might be sampling bits incorrectly.
- However, further analysis confirmed that timing was accurate.
-
Firmware or FPGA logic errors?
- I ran the same test on a simplified testbench, and the system produced correct results.
- The data only became corrupted in real-world multi-device configurations.
This meant the issue wasn’t random noise or signal corruption, but something systematic and repeatable. I needed to shift focus from raw hardware debugging to analyzing communication patterns.
A New Approach: Using Machine Learning to Decode the Chaos
Instead of trying to manually interpret the scrambled logs, I decided to convert the waveform data into structured tables for easier analysis. The SPI packet headers and framing were intact, but the extracted payloads did not align properly.
Applying Machine Learning for Pattern Analysis
To detect hidden structures within the corrupted logs, I applied:
- Pattern recognition techniques to identify recurring byte sequences.
- Clustering algorithms to group similar transactions and detect patterns.
- Anomaly detection models to spot irregularities in SPI payload structures.
| Transaction | Extracted Payload (Scrambled) |
|---|---|
| 0 | 0xCC |
| 1 | 0x55 |
| 2 | 0xB2 |
| 3 | 0x61 |
| 4 | 0x0C |
| 5 | 0x38 |
| 6 | 0xE9 |
| 7 | 0x4F |
| 8 | 0xC9 |
| 9 | 0x2D |
The Breakthrough: Reconstructing the Hidden Messages
Once I applied sequence matching, the real issue became clear. Long repeating byte sequences were consistently appearing at the start and end of different payloads.
This suggested that:
- The SPI relay mechanism was mismanaging packet encapsulation.
- The extracted payloads were not actually corrupted—they were misassembled.
- When concatenated in the correct order, they formed valid SPI messages.
To fix this, I:
- Refactored the SPI relay logic to ensure proper message reassembly.
- Developed an ML-assisted algorithm to automatically detect and reconstruct misaligned messages.
- Used Autoencoders to detect deviations in SPI data flow, helping identify future communication errors.
Results: Faster Debugging with AI-Assisted Insights
Once implemented, the improved system significantly reduced debugging time and made post-processing much more efficient.
Key Improvements
- Reduced debugging time by 70% through anomaly detection.
- Reconstructed 95% of misassembled messages, recovering otherwise lost information.
- Scalable to other SPI topologies, not just daisy-chained configurations.
By combining traditional signal analysis with machine learning-driven insights, I transformed the debugging process from manual trial-and-error to an intelligent, automated process.
Future Work: Expanding AI-Assisted Debugging
This approach opens up several interesting research directions:
- Extending ML-based debugging to other protocols (I²C, UART, CAN).
- Integrating real-time AI anomaly detection into FPGA logic itself.
- Developing a generalized debugging framework for various communication protocols.
The broader impact? Machine learning can turn raw signal data into actionable insights, making debugging smarter and more efficient.
Final Thoughts: Debugging Beyond Just Tools
One key lesson I learned is that debugging is not just about having the right tools—it’s about knowing how to use them effectively.
Traditional debugging methods like oscilloscopes and logic analyzers are useful, but raw waveforms alone don’t always tell the full story. When debugging high-speed communication systems, pattern recognition and machine learning can extract meaning from seemingly chaotic data, revealing issues that traditional tools might miss.
This experience also taught me the importance of rethinking assumptions. Instead of stubbornly looking for problems where I expected them to be, I had to analyze the data differently to find the real issue.
Debugging is an iterative process of stop, rethink, try, and repeat. Sometimes, the right tool isn’t a new one—it’s a new way of thinking.